.png)
.png)


SANTA RALLY: Is it Santa Claus or the Market Grinch?
- Dec 11, 2025
- 4 min read
Updated: Dec 12, 2025
The holidays are just around the corner, bringing not only a festive mood, but also a traditional and exciting phenomenon on the stock market: the so-called “Santa Rally”. This seasonal pattern gives investors hope for a small price gift every year. But what exactly is behind this myth? And above all: is this short-term magic a basis for investment decisions?

What exactly is the Santa Rally?
The Santa Rally refers to a statistically significant, above-average rise in stock prices during a short period at the turn of the year.
The rally covers the last five trading days of the year and the first two trading days of the new year.
Historical performance: The statistics speak for themselves:
The S&P 500 achieved positive returns in around 78% of cases during this period.
The average return in this short time window is around 1.3%.
This is well above the average for other seven-day periods, making the Santa Rally a real statistical anomaly.
The drivers behind the Christmas phenomenon
Why does the stock market rise at this time of year?
Psychology and holiday spirit: The positive mood of the holidays could increase private investors' willingness to take risks.
Lower trading volume: Many large institutional investors take time off over the holidays. The market is dominated more by private investors, whose buying activity can amplify price movements in this low-liquidity environment.
Year-end effects:
After tax-motivated sales (tax-loss selling) are completed in December, the selling pressure subsides.
Window dressing: Fund managers may still buy stocks with good performance at the end of the year.

Rally vs. Reality
A glance at the chart shows that the rally did indeed yield predominantly positive results, with positive returns achieved in 78% of cases, as already mentioned.
However, it is essential to place this short-term movement in the overall context of the year. Many people forget to look at the whole year behind it, and that is exactly what we will look at first.
In this chart, pay attention to the year 2008 and the resulting return during the rally.
The pattern in the crisis year of 2008
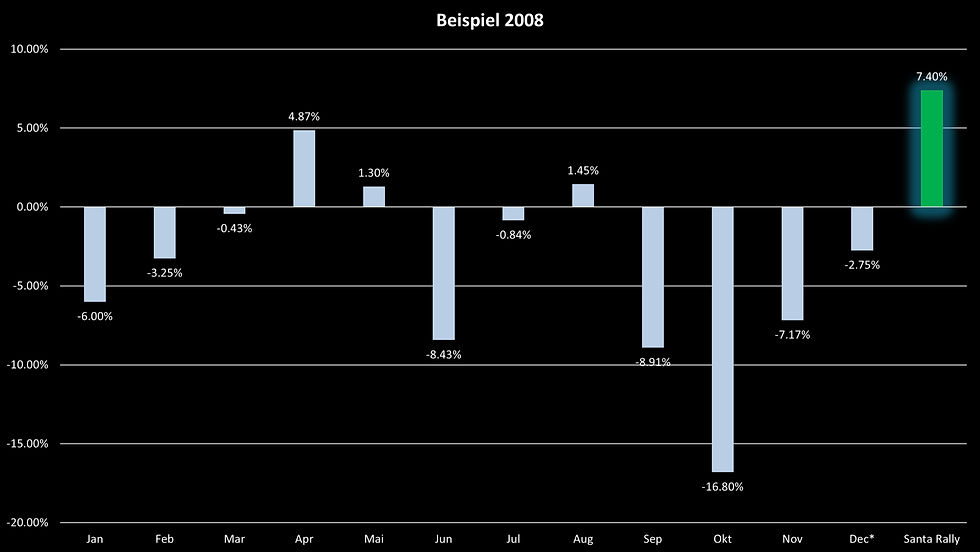
The 2008 financial crisis provides the strongest argument as to why short-term patterns do not provide any insight into long-term reality:
The annual balance sheet of reality: The S&P 500 recorded a catastrophic overall loss of -34.9% this year, including the rally. This was a period of profound uncertainty and market panic, with massive losses in the preceding months.
The brief rally euphoria: Despite this existential downturn, the S&P 500 jumped 7,40% during the brief rally period. Compared to the loss, this sounds like a drop in the bucket.
Investors who think short-term focus on this isolated gain as a quick price gift. Professional investors, on the other hand, recognize such patterns as isolated statistical anomalies. They know that this minimal increase had no impact on the fundamental macroeconomic problems that caused the -34.9% annual loss. The rally's gains did not offset the massive loss in any way.
The Santa Rally can deliver a positive return even in the worst bear market. This is not a signal of a market turnaround, but merely underscores the independence of the seasonal effect from long-term performance and is an interesting phenomenon of market movement during this particular period.
The opposite example in 1999
There are also examples where the market did not rally despite a fantastic annual performance. For example, the rally period at the end of 1999 delivered a negative return, even though the year as a whole and the following year were extremely strong. This proves that the rally does not necessarily correlate with general market strength.
No basis for investment
The Santa Rally is an exciting historical phenomenon. It proves that there are statistically favorable times of the year.
However, it is important to note that this pattern is not an investment recommendation and should not be used as a basis for investment decisions.
Statistics, not strategy: A successful investment strategy is based on thorough fundamental analysis, risk management, and diversification over decades, not on the calendar. The short-term magic of a seasonal effect cannot replace long-term, lasting prosperity.
Risk: Those who invest shortly before the rally in the hope of a quick profit expose themselves to the risk that macroeconomic factors or unexpected events (as in 2024) may negate the pattern and losses may be high in a short period of time.
As asset managers, we are aware of such patterns and their limited significance. We use them merely as one of many indicators in our comprehensive analysis. Leave speculation to the myth. If you want to believe in a reliable “Santa Claus” for your long-term finances, you are better off giving that status to a good asset manager.
Use the holiday season to review your long-term investment strategy

4E Capital wishes you a peaceful Christmas season
We hope this look at the Santa Rally has provided you with some exciting reading material for the holidays. As we monitor the historical patterns of the stock market, we would like to wish you one thing above all else: a peaceful Christmas season and a moment of calm away from the markets.
We thank you for your interest this year and look forward to providing you with more exciting analyses and market outlooks in the new year.
Your 4E Capital Family


